• Other vizzes

    Behind the viz: Game of the Year

    It’s been a long time since I’ve last posted anything on here. In fact, it’s been a long time since I’ve published a viz. I had to take a little break from vizzing. I just couldn’t find the energy to sit down and create anything. I’ve started several different projects but quickly gave up on them. But I tried to tell myself that it’s okay, that one of these days I’ll be blessed by the muse and get my creative juices flowing again. 

    Thankfully, I did come up with an idea for March’s #IronQuest challenge. So here it is – my contribution to the theme ‚Games‘. I finally created a viz inspired by one of my all time data viz heroes – Giorgia Lupi. And I finally got to use the new map layers in Tableau. I’ll tell you all about it in this blog.

    Click on the image to see the interactive version or download the workbook.

    Topic & Data Collection

    The theme for this month’s #IronQuest was ‚Games‘. For some reason, my immediate thought was Mario Kart – don’t ask me why. I actually started to look for data but nothing specific came to mind. But then I remembered the board games we used to play at home when I was younger. I remembered checking out the newest games in the toy catalog to see whether there were any cool new games I wanted to put on my Christmas wish list. And one major factor I remember was always which games won the most recent ‚Spiel des Jahres‘ (‚Game of the Year‘) award. This German board game award is super famous here and a pretty big deal. I found a list of all past winners on Wikipedia as a starting point and added some additional information about the games (game type, number of players,…) by browsing their wiki pages. Here’s the dataset I ended up with.

    Design & Preparation

    Next, I had to come up with a design for my viz. I wanted my design to reflect the overall topic of games. Basically, you should be able to get what the topic was simply by looking at the design. One thing I’d like to do to get some inspiration is a simple google image search – just type in ‚Board Game‘ and see what will come up! I quickly realized I needed my viz to resemble the game board itself! So each game would be represented by one field along the path on the game board. The rest of the data would be implemented using other shapes – Giorgia Lupi style.

    A simple mockup of a game board consisting of circles that create a path.
    A game board mock-up I created in Powerpoint.

    I started by creating a quick game board mock-up in Powerpoint, consisting of 42 circles (one for each game I wanted to depict) which form a bendy path. I loaded that into Tableau as a background image and used annotations to figure out the x and y coordinates of each individual circle. 

    With the coordinates out of the way, I went back to Powerpoint and began creating the shapes I wanted to use to encode the information in my viz. I first created the bubbles that I used for each game and that ultimately formed the path on the game board. I chose 6 different colors – one for each of the different board game types I had in my dataset. I added a radial gradient and some shadows for some texture and depth. 

    Bubble objects created in Powerpoint.

    Next, I included the other items and shapes I wanted to use to encode the other information: 1 to 3 triangles for the recommended minimum age, 1 to 3 bars for the game length and a circle for each possible player. And finally, a little heart for each game I personally have played before. I saved each set of objects separately as an image and moved it to the custom shapes folder in the Tableau repository.

    All the custom shapes I saved to later use in Tableau.
    Template for the final representation of a board game in the viz.

    Creating the viz

    All that was left was bringing it all together in Tableau. The new map layers in Tableau make this actually pretty easy. 

    1. Normalize the x and y coordinates by dividing them through the total length or width, respectively.
    2. Convert the coordinates into a geometric object with the MAKEPOINT() function.
    3. Bring in the geometric object as a map layer with the game ID on ‚Detail‘.
    4.  Use mark type ‚Shape‘ and put one of the other dimensions on shape (Number of Players, e.g.). Select the corresponding custom shapes.
    5. Repeat steps 1-4 until all elements are in the viz.
    And we’re done!
  • Other vizzes

    Behind the viz: Biggest boybands of all time

    A few days ago I published a new viz that I called The Biggest Boybands of all Time. This one has been flying around as an idea in my head for quite some time. But when I had a few days off after Christmas, I finally had time to sit down and actually create it. In this post, I’ll talk a bit more about how this viz came about.

    Idea & Data Collection

    This viz first started when I stumbled upon The Pudding’s awesome Internet Boy Band Database. This is a collection of boybands with No. 1 hits on the Billboard Hot 100, as well as more information about their members (such as age, physical traits, clothing style, etc.). This dataset was so much fun, however, it included a lot of qualitative data and not many numbers to do cool stuff with. But it got me googling and I soon wanted to find out what the most successful boybands of all time are. It’s actually surprisingly hard to find any decent data on that. Apparently, international record sales are not easily available. In the end, I settled for the numbers given in this Top 10 list by German music magazine Musikexpress. I then used good old Wikipedia to gather more information about the boybands on that Top 10 list. Overall, all of the information that is in the viz comes down to this (plus the names of the boyband members and the albums):

    Sketching & Data Preparation

    That’s where the real data prep fun only began, though! 

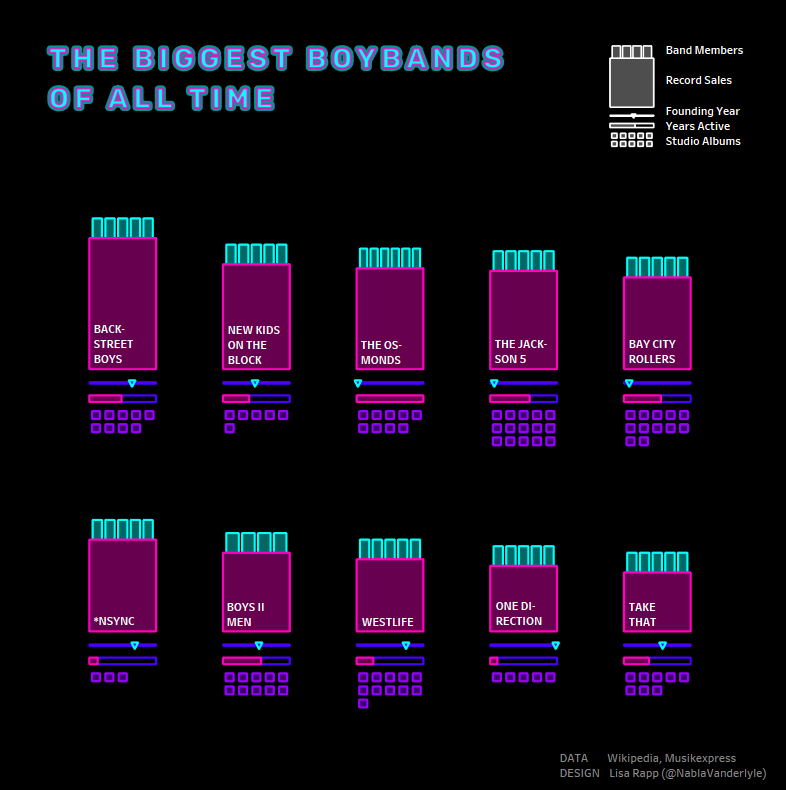
    For this viz, I started with some sketching (which I rarely do, but it was vital in this case)! As you can see, this first sketch is actually not that different from how the viz turned out in the end. I started with the top part and imagined the members (abstracted to be little blocks) standing on a kind of podium (which scales with the record sales). And then from that, I just thought of different ways to incorporate the other information I had gathered.

    Okay, I had an idea of where I wanted to go – but how to get there? Obviously, this whole construct consists of different viz types. So putting it all together in Tableau would either require a crazy amount of worksheets – or I would have to go down the polygon route. But that would require some more calculations and data prep.

    A raw sketch of the boybands data viz.

    I first divided the final object into individual polygons:

    • 1 small rectangle for each member of the boyband
    • 1 larger rectangle for the record sales
    • 1 very flat rectangle representing the timeline
    • 1 triangle as the marker on the timeline
    • 1 rectangle representing the bar for years active
    • 1 rectangle to fill up the rest of the bar
    • 1 square for each album

    You’ll now have to create a row of data for each polygon edge, specifying its position on the x and y axes. That’s how in the end that 10-row-dataset from above snowballed into more than 800 rows of data. There was lots of calculating but with a bit of patience, some more sketching and the help of Excel I figured it out. It truely felt like being back in geometry class at times.

    Creating the viz

    The cool thing about doing it all with polygons is that your viz comes together just like that, without you really having to do much additional work at all. You just set the mark type to ‚Polygon‘, pull all the things that will create the individual polygons onto the Details shelf and specify the path (i.e. the order in which the different edges of the polygon will be drawn). And voila – your viz is basically done!

    My initial idea was to keep it very simple, very minimalistic and keep it completely black and white (I guess I was still inspired by the recent #IronQuest challenge). I think it looks pretty cool as well, but I wasn’t 100% convinced. I felt like the simple colors did not really match the topic at hand. Boybands called for some more vibrant colors. For me, boybands equal 90s and 90s equal neon colors. So why not go full out neon?? I browsed Pinterest – my go-to source of inspiration for color schemes and landed on this cool color scheme on Imgur.

    Almost done! For the finishing touch, I wanted to create this neon-sign glowy effect. My polygons were not enough for that – I needed lines! Luckily, you can create almost the same viz by simply changing the mark type to ‚Line‘. The only catch is that you’ll need one datapoint more for each polygon: For example, if you want to create a square with a line you’ll need 5 data points. That 5th data point will be the one that brings you back to where you started drawing the square and thus close it off.

    So I duplicated my dataset, added the additional points and brought it back to Tableau. Then I gave my polygons some opacity and layered the lines on top of the polygons – and we’re done!

    TLDR – From sketch to first draft to final result
  • Other vizzes

    Are Best Practices always best?

    I recently published a viz in which I looked at some characteristics of world leaders in the last 70 years. I looked at four categories that each had two groups – Gender (Male/Female), Age Group (above/below 60), whether the leader was elected or not, and whether the country was a democracy or not. Here’s the viz I created:

    Here’s a question I feel is worth discussing:

    Should I have followed best practices for this viz?

    Let’s start by looking at some of the things I like about the viz as it is:

    • It piques my interest because it’s a little bit different than most vizzes I see.
    • I personally find it visually pleasing. I think it’s because I like the symmetry of the squares.
    • I think it manages to drive the basic message: I can tell how the ratios have changed over time.

    But what are some of the draw-backs I can identify?

    • We as humans are super bad at estimating areas. It’s the same problem I mentioned for my Child Marriage MakeoverMonday.
    • The numbers for each pair of squares always add up to 100%. That fact, however, is not obvious at first glance in this viz.
    • A simpler way to represent this data – and the one I would consider the best practice approach – would have been with a stacked bar chart. This would also make it easier to quickly see the change over time.

    So… taking the more experimental road with the dual squares or sticking to best practice and using a stacked bar chart? What’s the better approach in this case? I’m happy with the dual square chart in this context but in a business context, I would probably stick to the stacked bars. But I created a comparison below and you can judge for yourself which one you like better…

  • Other vizzes

    US National Parks – an #IronQuest viz

    A data viz about US National Parks.
    My submission to #IronQuest: A mobile guide to US National Parks

    THE THEME

    This viz was created for the September round of Iron Quest which focused on Mobile-First Dashboards. I was very excited about this theme. Designing specifically for mobile was something I’ve had on my to-do list for a while. So this was a great opportunity to finally tackle this.

    THE TOPIC

    Since the theme was entirely focused on the design, it didn’t really set any limits on the topic of the viz itself. But I quickly settled on US National Parks as the topic for my viz. Since we can’t really travel because of the pandemic right now, I’ve started to do some research on potential travel plans for the future. And US National Parks are high on my post-pandemic travel bucket list. But I usually try to avoid the crowds. So I was especially interested to find out what the peak season for different parks are.

    THE DATA

    • The National Park Service provides some detailed reports on visitor stats.
    • I also used the National Park Service’s website to learn about the geology and landscapes in the parks.
    • I pulled the park descriptions and basic information from Wikipedia.
    • Wikipedia also had a list of mountains/elevations.
    • I found a data set about biodiversity in the National Parks on Kaggle.
    • Finally, I found more information about popular activities on us-parks.com.

    My data prep involved a lot of copying and pasting, and typing values into an Excel sheet manually. Not very sophisticated, but it did its job in the end.

    THE DESIGN

    For this viz, I actually started with the background. I’ve always wanted to try a gradient background. I scoured Pinterest for inspiration and found this greenish-blue gradient – which I felt would work well for the topic. I created the background in Powerpoint. I also used Powerpoint to create all the buttons. and the tree logo.

    I kept the visualizations themselves pretty simple. I stuck to pretty basic graph types overall and a monochrome black color scheme.  I used viz types like the stacked dots to get invididual marks for each National Park. This way, I was able to link them to the details page by a go-to action.

    Last point of order was including all the buttons and configuring the navigation. This actually took ages! Oh how I wish Tableau had a copy and paste function for stuff like that.

    THE VERDICT

    This #IronQuest challenge was super fun! It really motivated me to pay more attention to mobile design in the future. It’s definitely challenging – configuring all the navigation needed to make it work was quite time-consuming. On the other hand, it really forces you to keep a tight focus and to sharpen your message – which is a good exercise for any kind of dashboard!