A year of MakeoverMonday
Welcome to a new year, dear reader! 2020 is finally gone. Time for one last look back before we put it on the ash heap of history where it belongs. Last week, I already reflected on all the vizzes I created in 2020. A huge part of those vizzes came from MakeoverMonday. So in this post, I’ll specifically talk about my MakeoverMonday experience.
By the end of 2019, I had learned all the Tableau basics and passed the Tableau Desktop Certified Associate Exam. So what next? I already knew of MakeoverMonday and had used some of the older datasets to build my Tableau skills. But for 2020 I decided it was time to become actively involved. So when the new year arrived, I set myself a new goal: Complete all #MakeoverMonday challenges in 2020!
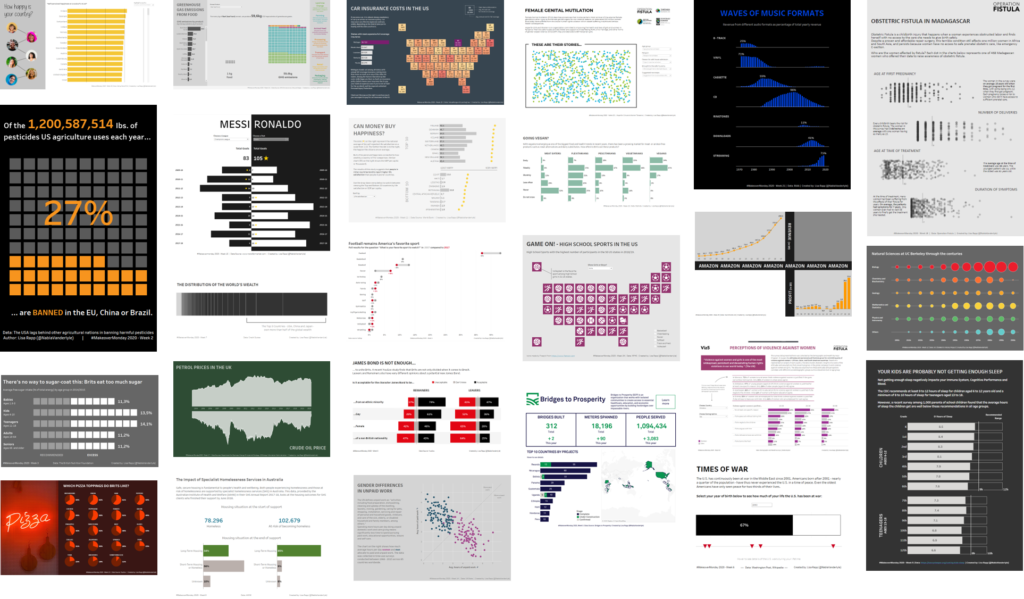
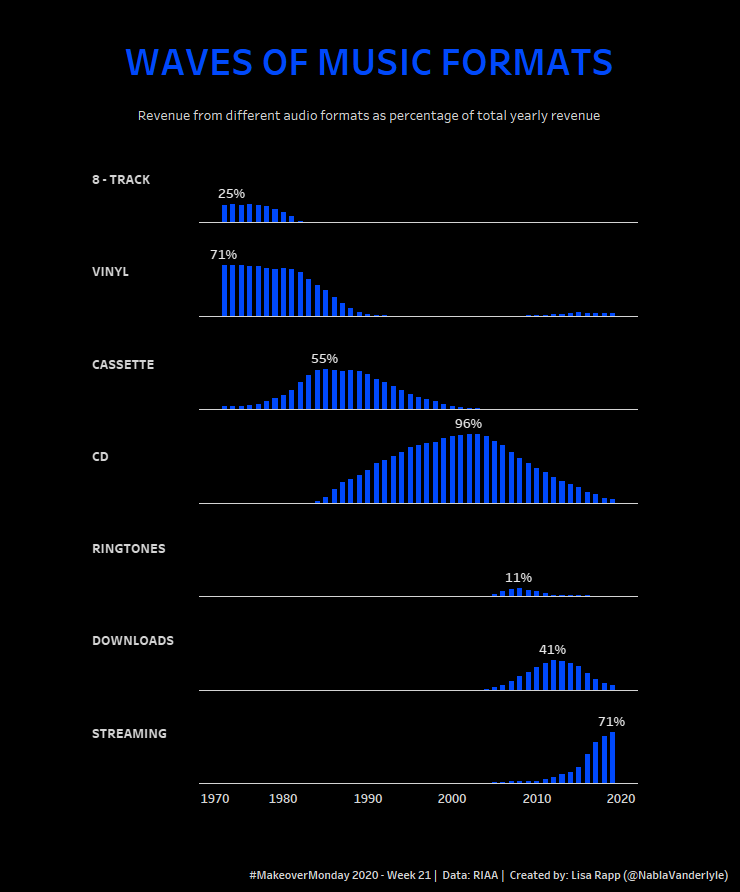
Now that 2020 is over I can proudly report that I did it (well, almost… I’m still missing Week 47 but I’m just going to ignore that). So here it is – at a glance – a year’s worth of MakeoverMonday vizzes:


As you would expect, not every one of those vizzes is a hit. But there are actually very few that I don’t like at all and many that I still like quite a bit.
My favorite vizzes
Here are some of my personal favorites:
Child Marriage
The nested squares to show parts of a whole are still one of my favorite new viz types I’ve done this year. Even though they might not be 100% best practice, I think they look pretty. I’ve used them in several other vizzes since and I’m sure they’ll come up every now in then in my future vizzes as well. This viz was also the first MakeoverMonday viz I blogged about here on this blog.
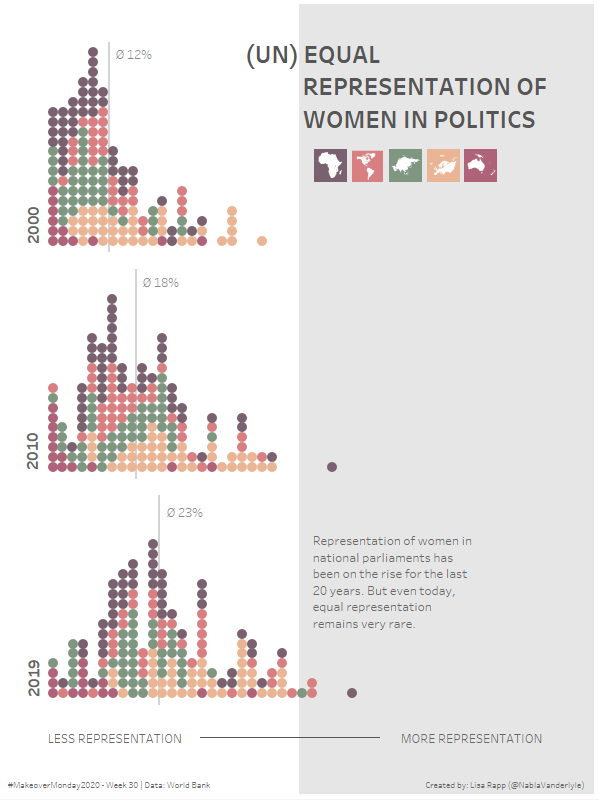
Representation of women in politics
This one looks like a book cover. More specifically, like the MakeoverMonday book. I swear that wasn’t intentional, but it must have been in the back of my mind somewhere. I remember it took me quite a while to make it look neat but I think it was worth the effort. I still like the design and the use of blank space to show where representation is lacking.
Sugar consumption in Britain
This one holds a special place in my heart. This is way back from Week 3. I think this was the first time I submitted a viz to viz review. Charlie and Eva gave some great advice and I went back and revised my viz. This then became the first viz that was picked as a favorite at the end of the week.
Lessons learned
Looking back at my year of MakeoverMonday vizzes – what are some of my key takeways?
- Consistency is key: My main motivation for starting this project was to consistently create vizzes. MakeoverMonday gives you the easiest opportunity to do exactly that. You don’t have to spend time thinking about a topic and gathering the data. You can just go ahead and create.
- Not every dataset is gonna be equally appealing to you and that’s okay: With 52 different topics in the year, it’s quite obvious that some weeks will be harder than others. Sometimes the topic might not be as interesting to you or be something you know nothing about (Looking at you, Week 35 Cricket dataset). I was very aware of that fact when I started and promised myself to not let that deter me from creating a viz anyway. Honestly, it’s been good practice for my work as well, because let’s be real – your clients data will not always be the most exciting data you’ve ever seen or you might be having a hard time coming up with an idea in the beginning. Working through all the MakeoverMonday topics helped me prepare for that situation and assured me that I can in fact make a viz out of every topic thrown at me.
- If you’re short on time – make that part of the challenge: In the beginning, I blocked a few hours on Sunday afternoon to create my viz, often with more time needed on Monday to finish it. But soon I found that I couldn’t keep up that time commitment. And the point is – you really don’t need to spend that much time on it. If you’re worried about the amount of time you’ll have to invest, I can only recommend trying time-boxing, i.e. limiting the time spent on creating a viz to maybe 1-2 hours. It’s actually a very useful exercise and something that’ll easily happen to you in real life anyway.
- When in doubt – bar charts: Okay, it’s obviously not as simple as that. But when you look at all the vizzes I created you’ll see that there are many variations of bar charts in there. You’ll find the same thing if you go through the weekly favorites on the MakeoverMonday blog. Many of the MakeoverMonday datasets are pretty simple and that’s why simple bar charts are often the easiest and most effective way to present the data. I often feel like I need to invent a new chart type or do something super outlandish. But perfecting the bar chart can be a great goal, too!
- Try something new with every viz: I tried to adhere to that rule as much as I could and incorporate something new, something I had never done before into each viz I created. It could be anything from a new chart type that I’ve never done before, or a Tableau feature I haven’t used before, to something as simple as a specific color I’ve always wanted to use.
What’s next?
After a year of MakeoverMondays, I still think it is one of the best datafam initiatives out there. It’s so much fun and the feedback you can get from it is so valuable. I don’t necessarily plan on doing all 52 MakeoverMondays again this year, but I’ll try my best to do as many as I can. There’s still a lot of things to learn and improve, so let’s keep practicing!


